SIEM sizing is all about estimating the resources your Security Information and Event Management (SIEM) system that needs to handle log data efficiently—without overprovisioning or underestimating. The two key metrics used are:
- Events Per Second (EPS): The number of log events generated per second.
- Gigabytes per Day (GB/day): The total volume of log data is ingested daily.
To calculate SIEM sizing, you typically keep the documentation on the following:
- Inventory Your Devices: Count all log-generating sources—servers, endpoints, firewalls, routers, applications, etc.
- Estimate EPS per Device Type: For example, a domain controller might generate 300–500 EPS, while a workstation might only produce 1–5 EPS.
- Calculate Total EPS: Multiply the number of each device type by its average EPS and sum them up.
- Convert EPS to GB/day: Use a conversion factor (often 1,000 EPS ≈ 8.6 GB/day, though this varies by log verbosity).
- Factor in Retention and Growth: Include how long you’ll store logs and expected growth over time.
If you want a hands-on tool, Logpoint’s SIEM Sizing Calculator and Positka’s SIEM Sizing Calculator are both excellent for generating estimates based on your infrastructure.
Let’s break it down with some rough estimates to size your SIEM based on the infrastructure you mentioned:
Estimated SIEM Sizing Inputs
| Device Type | Quantity | Avg EPS (Events/sec) | Total EPS |
| Endpoints | 7,000 | 2 | 14,000 |
| Core Routers | 4 | 300 | 1,200 |
| Load Balancers | 2 | 200 | 400 |
| Estimated Total EPS | 15,600 |
EPS values are approximations based on typical enterprise environments. Actual values may vary depending on logging verbosity and configurations.
Data Volume Estimation
A common conversion is:
- 1,000 EPS ≈ 8.6 GB/day
So:
- 15,600 EPS ≈ ~134 GB/day
- Monthly ≈ ~4 TB
- Yearly ≈ ~48 TB
Additional Considerations
- Retention: If you retain logs for 90 days hot and 1 year cold, storage needs will scale accordingly.
- Growth: Plan for 20–30% annual growth in log volume.
- Use Case Complexity: Advanced analytics, threat hunting, and compliance reporting may require more compute and storage.
Based on your earlier setup—7,000 endpoints, 4 core routers, and 2 load balancers—we estimated a total of 15,600 EPS (Events Per Second). Using the industry-average conversion:
- 1,000 EPS ≈ 8.6 GB/day
So your SIEM should be prepared to ingest approximately:
- 15,600 EPS × 8.6 GB/day per 1,000 EPS ≈ 134 GB/day
- Monthly ≈ ~4 TB
- Annually ≈ ~48 TB
This is your baseline ingestion rate. But to size your SIEM effectively, you should also factor in:
- Log retention policies (e.g., 90 days hot, 1 year cold)
- Burst capacity for peak traffic (e.g., patch Tuesdays, incident spikes)
- Log enrichment overhead (e.g., threat intel tagging, parsing)
- Future growth (typically 20–30% annually)
If you’re leaning toward a cloud-native SIEM like Microsoft Sentinel or Chronicle, ingestion costs and storage tiers (hot vs. archive) will also influence your architecture.
Now, let’s sketch a hybrid or multi-cloud SIEM architecture based on your enterprise profile. Given your mix of ~7,000 endpoints and core infrastructure, you’ll want a design that supports scalability, cost-efficiency, analytics depth, and data sovereignty. Here’s a conceptual model:
Hybrid SIEM Architecture for 7,000-Seat Enterprise
1. Data Sources
- Endpoints, routers, firewalls, load balancers, apps, cloud workloads
- Normalize using agents (e.g., Sysmon, NXLog, Fluentd) or log forwarders
2. Ingestion Layer
- Lightweight, regionally distributed collectors/buffers
- Support for batch and stream-based ingestion (e.g., Kafka or Event Hubs)
3. Log Preprocessing (Optional Edge Tier)
- Field mapping, threat enrichment (GeoIP, WHOIS, Intel feeds)
- Initial de-duplication, filtering noisy logs
4. SIEM Core Platform
- Hot Analytics Tier: Real-time processing (UEBA, correlation, detections)
- Cold/Archive Tier: Low-cost object storage for compliance & forensic searches
Options:
- Cloud-native (e.g., Microsoft Sentinel, Google Chronicle)
- Hybrid (e.g., Elastic Stack on-prem + archive in Azure Blob)
5. Integration Layer
- Identity: Azure AD, Okta, Oauth, OpenID etc.
- SOAR: Playbooks for automated triage/response
- Case management: ServiceNow, JIRA integration
6. Dashboards & Alerting
- SOC dashboard with MITRE ATT&CK overlays
- KPI visualizations (EPS rate, ingestion cost, threat trends)
Estimating Ingestion in This Model
- Hot Tier: 134 GB/day (~15,600 EPS)
- Retention: 30–90 days
- Indexed for analytics
- Cold Tier: Compressed archival (~5–10 TB/year)
- Retention: 1+ years
- Searchable but not indexed
Add-ons:
- Burst Buffering: Absorb sudden EPS spikes with log shunting
- Data Tiering Rules: Route high-value vs low-value logs smartly
Here is your custom architectural diagram illustrating a hybrid SIEM design—with AI-based anomaly detection and graph-powered lateral movement tracking seamlessly integrated. This should blend your technical precision with your design instincts.
Let’s bring this architecture to life visually. I’ll sketch out a high-level hybrid SIEM architecture diagram tailored for your ~7,000-user enterprise. It’ll highlight:
- Log sources and ingestion flow
- Core analytics (hot path) and storage (cold path)
- Integration with cloud-native AI/ML and SOAR
- Data tiering and retention strategy
Since we’re cruising ahead, here are a few exciting directions we could explore next:
- AI-Driven Threat Modeling: Want to integrate ML to predict potential attack vectors before they happen?
- Designing Reference Architectures: Draft a cloud-native reference architectures (Azure, AWS, hybrid) tailored for regulated or scalable environments.
- Custom Detection Use Cases: Build detections aligned to MITRE ATT&CK or specific to industries like finance, healthcare, or critical infrastructure.
- Visual Storytelling for Security Dashboards: get pro help designing sleek, metallic-themed SOC dashboards that don’t just inform but impress
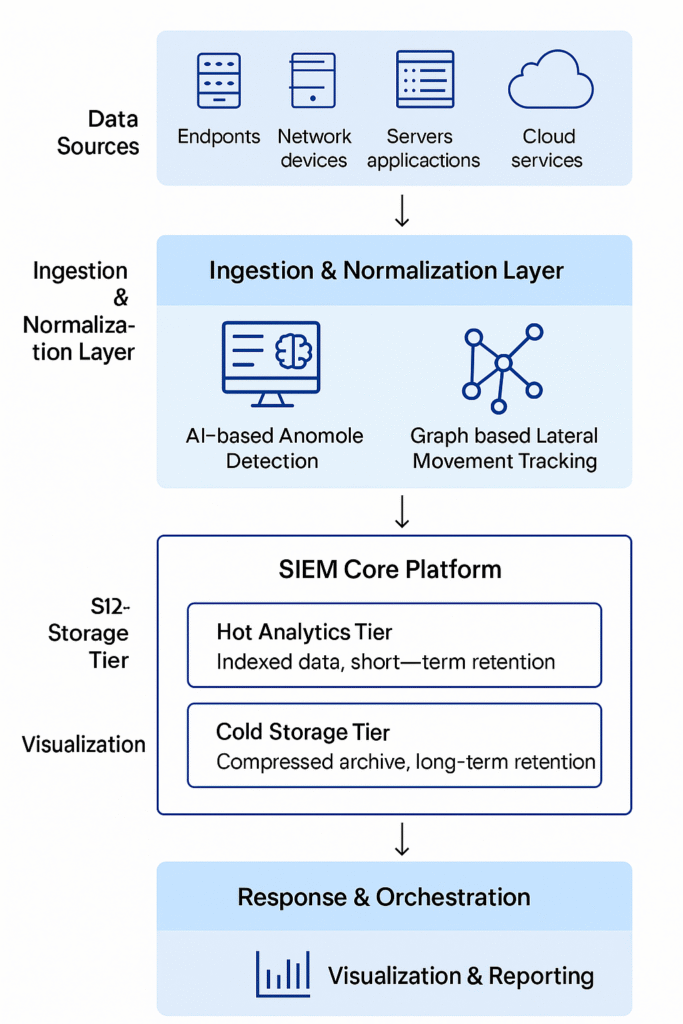
Let’s break down the hybrid SIEM architecture with AI-based anomaly detection and graph-based lateral movement tracking into its core layers—nice and clean:
1. Data Sources
These generate the raw telemetry:
- Endpoints (Windows/Mac/Linux devices with agents like Sysmon)
- Networked Devices (routers, load balancers, switches)
- Servers & Applications (on-prem & cloud)
- Cloud Logs (Azure AD sign-ins, AWS CloudTrail, GCP audit logs)
- Security devices (Firewall, HSM Cryptography, WAF, DDoS Filters etc.)
2. Ingestion & Normalization Layer
Handles diverse data input:
- Forwarders/Agents: NXLog, Beats, Fluentd
- Buffering Pipelines: Apache Kafka, Azure Event Hubs
- Log Shapers: Normalize formats (e.g., JSON, Syslog)
3. AI & Detection Analytics Layer
This is the intelligence core:
- Anomaly Detection Models: Learn user/device baselines & flag outliers (e.g., Defender for Endpoint ML, UEBA in Sentinel)
- Graph Models: Map users, devices, sessions, and behaviors to detect lateral movement paths (think of BloodHound-like modeling, but real-time)
- Correlation Engine: Chains together signals from multiple sources across time
4. Hot Analytics Tier
Fast-access data:
- Indexed, searchable logs for up to 90 days
- Supports real-time dashboards, threat hunting, alerting
- Often lives in high-throughput services (Elastic, Kusto, etc.)
5. Cold Storage Tier
Long-term retention:
- Compressed archive (Azure Blob, Amazon S3, GCP Coldline)
- Lower cost, slower access
- Useful for compliance and long-term forensics
6. Response & Orchestration
Turning detection into action:
- SOAR Integration: Automated triage, alert enrichment, ticket generation (via tools like Azure Logic Apps, XSOAR)
- Case Management: Create incidents, track resolution in JIRA, ServiceNow
- Playbooks: E.g., auto-block an IP, disable an account, notify SOC lead
7. Visualization & Reporting
Human-centric insights:
- SOC Dashboards: Live threat trends, ingestion volume, EPS spikes
- Investigation Timelines: Linked user/machine sessions
- Compliance Reports: PCI-DSS, ISO, MITRE etc.
Here is a custom layered diagram—visualizing a hybrid SIEM architecture with AI-driven anomaly detection and graph-based lateral movement tracking fully integrated:
AI-based Anomaly Detection or Graph Modeling for Lateral Movement Tracking
Let’s get into details on how AI-based anomaly detection and graph modeling work together to detect lateral movements—a stealthy tactic used by attackers to pivot across systems after initial compromise.
AI-Based Anomaly Detection
This approach uses machine learning to learn what “normal” behavior looks like across your network—then flags deviations. Key techniques include:
- Unsupervised Learning: No labeled data needed. Algorithms like Isolation Forests or Autoencoders detect outliers in login times, access patterns, or data transfers.
- User and Entity Behavior Analytics (UEBA): Models baseline behaviors for users/devices and detects anomalies like:
- A user logging in from two locations simultaneously
- Accessing systems they’ve never touched before
- Temporal Modeling: Recurrent Neural Networks (RNNs) or LSTMs can model sequences of events over time to detect suspicious transitions.
Graph Modeling for Lateral Movement
Graph-based approaches model your network as a graph of entities (users, devices, services) and edges (authentication, access, communication). This enables:
- Graph Neural Networks (GNNs): Learn complex relationships and detect suspicious paths.
- Temporal Graphs: Capture how connections evolve over time—critical for spotting stealthy lateral movement.
- Anomalous Edge Detection: Identify unexpected or low-probability connections (e.g., a user authenticating to a server they’ve never accessed).
Real-World Frameworks
- Euler (GitHub): Uses scalable temporal graph link prediction to detect anomalous connections. It separates GNN and RNN layers for distributed performance.
- LMDetect (arXiv): Builds a heterogeneous multigraph from authentication logs and uses a time-aware subgraph classifier with multi-scale attention to detect lateral movement.
- CTLMD (Springer): Embeds login paths using graph embeddings and classifies them as normal or malicious based on temporal behavior.
- Latte (Microsoft Research): Combines graph-based rare path detection with remote file execution signals to detect lateral movement at enterprise scale.
How It All Fits Together
Imagine this pipeline:
- Ingest logs (auth, network, endpoint)
- Build a temporal graph of entities and interactions
- Apply GNNs or anomaly detection models to detect:
- Unusual access paths
- Suspicious privilege escalations
- Time-based deviations
- Trigger alerts or SOAR playbooks for investigation
Let’s roll up our sleeves and architect a working model for AI-based anomaly detection and graph-based lateral movement tracking using tools you can tinker with or scale for production.
Prototype Architecture: AI + Graph for Threat Detection
1. Data Collection & Normalization
- Sources: Authentication logs (e.g., Windows Event ID 4624), process trees, network flows
- Pipeline: Beats/NXLog → Kafka/Event Hubs → Logstash/Fluentd
- Normalization: Convert all logs into a graph-friendly schema (e.g., user-logon-host, process-parent-child)
2. Graph Construction (Dynamic or Static)
- Use a graph database like Neo4j or TigerGraph
- Nodes: Users, Hosts, Processes, Files, Resources
- Edges: Authentications, Process Trees, Network Connections, Privilege Escalations
- Edge Properties: Time, frequency, success/fail, directionality
Example:
(User:Alice)-[LOGON {time: 09:12, success: true}]->(Host:Server01)
3. AI/ML Modules
A. Anomaly Detection Engine
- Use Autoencoders, Isolation Forests, or One-Class SVMs
- Feature vectors include login time, frequency, accessed resources, endpoint baseline behavior
- Output: A “surprise score” or risk percentile
B. Graph Neural Networks (GNNs)
- Libraries: PyTorch Geometric, DGL, or TensorFlow GNN
- Use link prediction or subgraph classification
- Train on “normal” subgraphs to flag unexpected connections or rare paths (e.g., User → DB → DC)
4. Lateral Movement Detection
- Apply path rarity scoring: How statistically unlikely is the observed sequence?
- Cross-check with MITRE ATT&CK tactics (especially TA0008 – Lateral Movement)
- Highlight sequences like:
- User logs into HR system → Spawns PowerShell → Connects to Domain Controller
5. Orchestration & SOC Integration
- Feed flagged events into SOAR tools (e.g., Sentinel Playbooks, XSOAR)
- Trigger automated investigation steps: IP traceback, credential revocation, ticket creation
6. Visualization & Analyst Tools
- Use Neo4j Bloom, Cytoscape, or Power BI Graph Extensions
- Dashboards:
- Entity behavior timelines
- High-risk node maps (hotspots of unusual access)
- “Blast radius” graphs for compromised accounts
Lets try building a Python prototype that ingests logs, creates a graph, and runs an anomaly detection model—or design this with Azure-native services (Sentinel + Kusto + Microsoft Graph + Defender for Identity). We’ll create a mini threat detection engine using Python, focused on:
- Ingesting log data
- Building a graph of entities and relationships
- Running anomaly detection to flag unusual lateral movement
We’ll use:
- pandas for log handling
- networkx for graph construction
- sklearn for anomaly detection (Isolation Forest)
Step 1: Simulate Auth Logs: Let’s generate sample authentication log data as a baseline.
import pandas as pd
from datetime import datetime, timedelta
import random
users = [‘alice’, ‘bob’, ‘carol’, ‘dave’]
hosts = [‘host1’, ‘host2’, ‘host3’, ‘dc1’]
timestamps = [datetime.now() – timedelta(minutes=random.randint(0, 120)) for _ in range(20)]
data = {
‘timestamp’: random.choices(timestamps, k=20),
‘user’: random.choices(users, k=20),
‘host’: random.choices(hosts, k=20),
‘success’: random.choices([True, True, False], k=20)
}
df_logs = pd.DataFrame(data)
print(df_logs.head())
Step 2: Build the Auth Graph: Now we’ll model logons as edges between users and hosts.
import networkx as nx
G = nx.DiGraph()
for _, row in df_logs.iterrows():
user_node = f”user:{row[‘user’]}”
host_node = f”host:{row[‘host’]}”
G.add_node(user_node, type=’user’)
G.add_node(host_node, type=’host’)
G.add_edge(user_node, host_node, timestamp=row[‘timestamp’], success=row[‘success’])
print(f”Graph has {G.number_of_nodes()} nodes and {G.number_of_edges()} edges.”)
Step 3: Apply Anomaly Detection (Simplified): We’ll extract a few behavioral features for anomaly scoring.
from sklearn.ensemble import IsolationForest
# Feature: Number of unique hosts accessed per user
features = df_logs.groupby(‘user’).host.nunique().reset_index(name=’host_access_count’)
model = IsolationForest(contamination=0.25)
features[‘anomaly_score’] = model.fit_predict(features[[‘host_access_count’]])
print(features)
Step 4: Visualize the Lateral Movement Graph
We’ll use matplotlib and networkx to generate a simple visual map of how users log into different hosts:
import matplotlib.pyplot as plt
plt.figure(figsize=(12, 6))
pos = nx.spring_layout(G, seed=42)
# Color users and hosts differently
node_colors = [‘skyblue’ if ‘user:’ in node else ‘lightgreen’ for node in G.nodes]
nx.draw(G, pos, with_labels=True, node_color=node_colors, node_size=1000, font_size=10, edge_color=’gray’)
plt.title(“User-Host Authentication Graph”)
plt.show()
This gives you a graph of logon relationships—helpful for spotting unexpected jumps or unusual pivot paths.
Step 5: Prototype Detection Pipeline with Live Logs
Let’s imagine you want to run this in a more automated or scalable way. You could build:
- Ingestion: Parse logs directly from a SIEM (e.g., Sentinel’s REST API or local syslog server)
- Batch Job: Clean logs, reconstruct session graphs hourly
- ML Analysis: Feed subgraph features into pre-trained anomaly models
- Action: Flag risky paths to the SOC dashboard or trigger automated playbooks
Option: Deploy in Azure
You could fully build this detection pipeline in Azure:
| Component | Service |
| Ingestion | Azure Event Hubs / Log Analytics |
| Graph Processing | Azure Cosmos DB (Gremlin API) or Neo4j (VM) |
| ML Model Execution | Azure ML or Azure Functions (with Scikit-learn) |
| Automation | Azure Logic Apps / Sentinel Playbooks |
| Visualization | Power BI with Graph APIs |