 Reading Time: 3 minutes
Status: Final Blueprint
Author: Shahab Al Yamin Chawdhury
Organization: Principal Architect & Consultant Group
Research Date: May 29 , 2022
Location: Dhaka, Bangladesh
Version: 1.0
1.0 Executive Summary
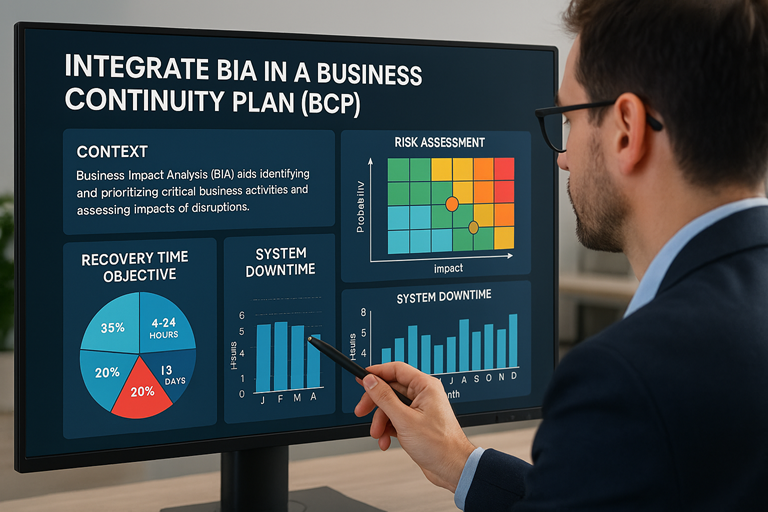
This blueprint outlines a data-driven framework for integrating the Business Impact Analysis (BIA) into the Business Continuity Plan (BCP). The core principle is that a BCP without a rigorous BIA is based on assumption, not evidence. The BIA serves as the analytical engine, providing quantifiable data to identify critical business functions, define recovery objectives, and justify resource allocation. This integration moves an organization from reactive, event-based planning to a proactive, impact-based resilience strategy, ensuring the BCP is intelligent, efficient, and aligned with core business objectives.
2.0 The Resilience Ecosystem: Core Components
A resilient organization is built on four distinct but interconnected pillars. Their relationship is hierarchical, with each component informing the next.
- Risk Assessment (RA): Identifies potential threats and vulnerabilities. Answers: “What could happen?”
- Business Impact Analysis (BIA): Predicts and quantifies the consequences of a disruption to business functions. Answers: “If it happens, how bad will it be?”
- Business Continuity Plan (BCP): The overarching strategic framework to maintain essential functions during a disruption. Answers: “How will we respond and continue?”
- Disaster Recovery Plan (DRP): The tactical, technology-focused subset of the BCP for restoring IT systems and data.
3.0 The Business Impact Analysis (BIA) Process
The BIA is a structured project to systematically determine and prioritize business functions.
3.1 BIA Phases
- Scoping & Engagement: Define objectives, secure executive sponsorship, and assemble a cross-functional team.
- Information Gathering: Use a mix of interviews, surveys, and workshops with subject matter experts to collect qualitative and quantitative data.
- Analysis & Validation: Analyze data to prioritize functions, document findings, and secure approval from department leadership.
3.2 Quantifying Impact
Impact is measured across multiple dimensions and escalates over time. This data is captured in an Impact Assessment Matrix.
Impact Assessment Matrix Example
| Business Process | Impact Category | <4 Hrs | 4-24 Hrs | 24-72 Hrs | >1 Week |
| Online Payment Processing | Financial | 5 | 5 | 5 | 5 |
| Reputational | 3 | 4 | 5 | 5 | |
| Monthly Financial Close | Financial | 1 | 1 | 3 | 4 |
| Regulatory | 1 | 1 | 2 | 5 |
(Scale: 1=Insignificant to 5=Catastrophic)
3.3 Defining Recovery Objectives
The BIA translates impact data into time-based targets that govern the BCP.
- Maximum Tolerable Downtime (MTD): The absolute maximum time a function can be unavailable before causing irreparable harm. This is a business decision.
- Recovery Time Objective (RTO): The target time within which a business process must be restored. RTO ≤ MTD.
- Recovery Point Objective (RPO): The maximum acceptable amount of data loss, measured in time. Dictates backup/replication frequency.
Criticality Tiering & Recovery Objectives Matrix
| Process ID | Process Name | Tier | MTD | RTO | RPO |
| FIN-001 | Online Payment Processing | 1 | 30 Min | 15 Min | 1 Min |
| OPS-001 | Customer Support Call Center | 1 | 4 Hrs | 2 Hrs | 15 Min |
| FIN-002 | Monthly Financial Close | 3 | 5 Days | 72 Hrs | 24 Hrs |
| HR-003 | Employee Training Portal | 4 | 2 Weeks | 1 Week | 48 Hrs |
4.0 The BIA-BCP Integration Framework
The BIA’s findings are systematically translated into the BCP’s strategies and resource plans.
4.1 From Data to Strategy
- Priorities: The BIA’s criticality tiers directly define the BCP’s “order of recovery.”
- Strategies: RTO and RPO values determine the required recovery strategies (e.g., a 15-minute RTO mandates high-availability architecture, while a 72-hour RTO can be met with nightly backups).
- Justification: The BIA’s financial impact data provides the cost-benefit analysis to justify investments in resilience.
4.2 Resource Gap Analysis
The BIA identifies the minimum resources (personnel, technology, facilities, vendors) needed for recovery. These requirements are compared against current capabilities to identify gaps.
BCP Resource Gap Analysis Matrix Example
| Process ID | Resource Category | Required Capability | Available Capability | Gap | Mitigation Strategy |
| FIN-001 | Personnel | 5 trained staff in 1 hr | 2 trained staff | 3 staff | Cross-train adjacent team |
| FIN-001 | Technology | RTO: 15 min | RTO: 4 hrs | 3h 45m | Implement active-active architecture |
| OPS-001 | Facility | 100 alternate seats | 50 seats at DR site | 50 seats | Contract with 3rd-party provider |
5.0 Governance and Continuous Improvement
A BCP is a living program that requires a continuous lifecycle of validation and improvement.
5.1 Testing and Validation
- Exercises: Regularly test the BCP using tabletop exercises, simulations, and full-scale tests.
- Feedback Loop: Measure the Actual Recovery Time (ART) against the BIA-defined RTO. If ART > RTO, the plan, resources, or RTO must be re-evaluated.
5.2 Key Performance Indicators (KPIs)
Use KPIs to provide a quantitative, at-a-glance view of the program’s health.
| KPI Category | Key Performance Indicator (KPI) | Target |
| BIA Health | % of Critical Processes with a current BIA (<12 mo) | > 95% |
| Plan Readiness | % of Critical Processes with an approved BCP | 100% |
| Testing | % of Tier 1 Processes tested in last 12 months | 100% |
| Gap Management | Number of open High-Priority gaps | < 5 |
5.3 Strategic Outlook: Operational Resilience
The discipline is evolving from reactive BCM to proactive Operational Resilience, which focuses on ensuring the continuity of critical end-to-end business services as experienced by the customer. A data-driven, integrated BIA-BCP framework is the essential foundation for this strategic evolution.